Industry

IT Management Software

Client

Eido

Eido. Cloud-based Intune management and monitoring tool
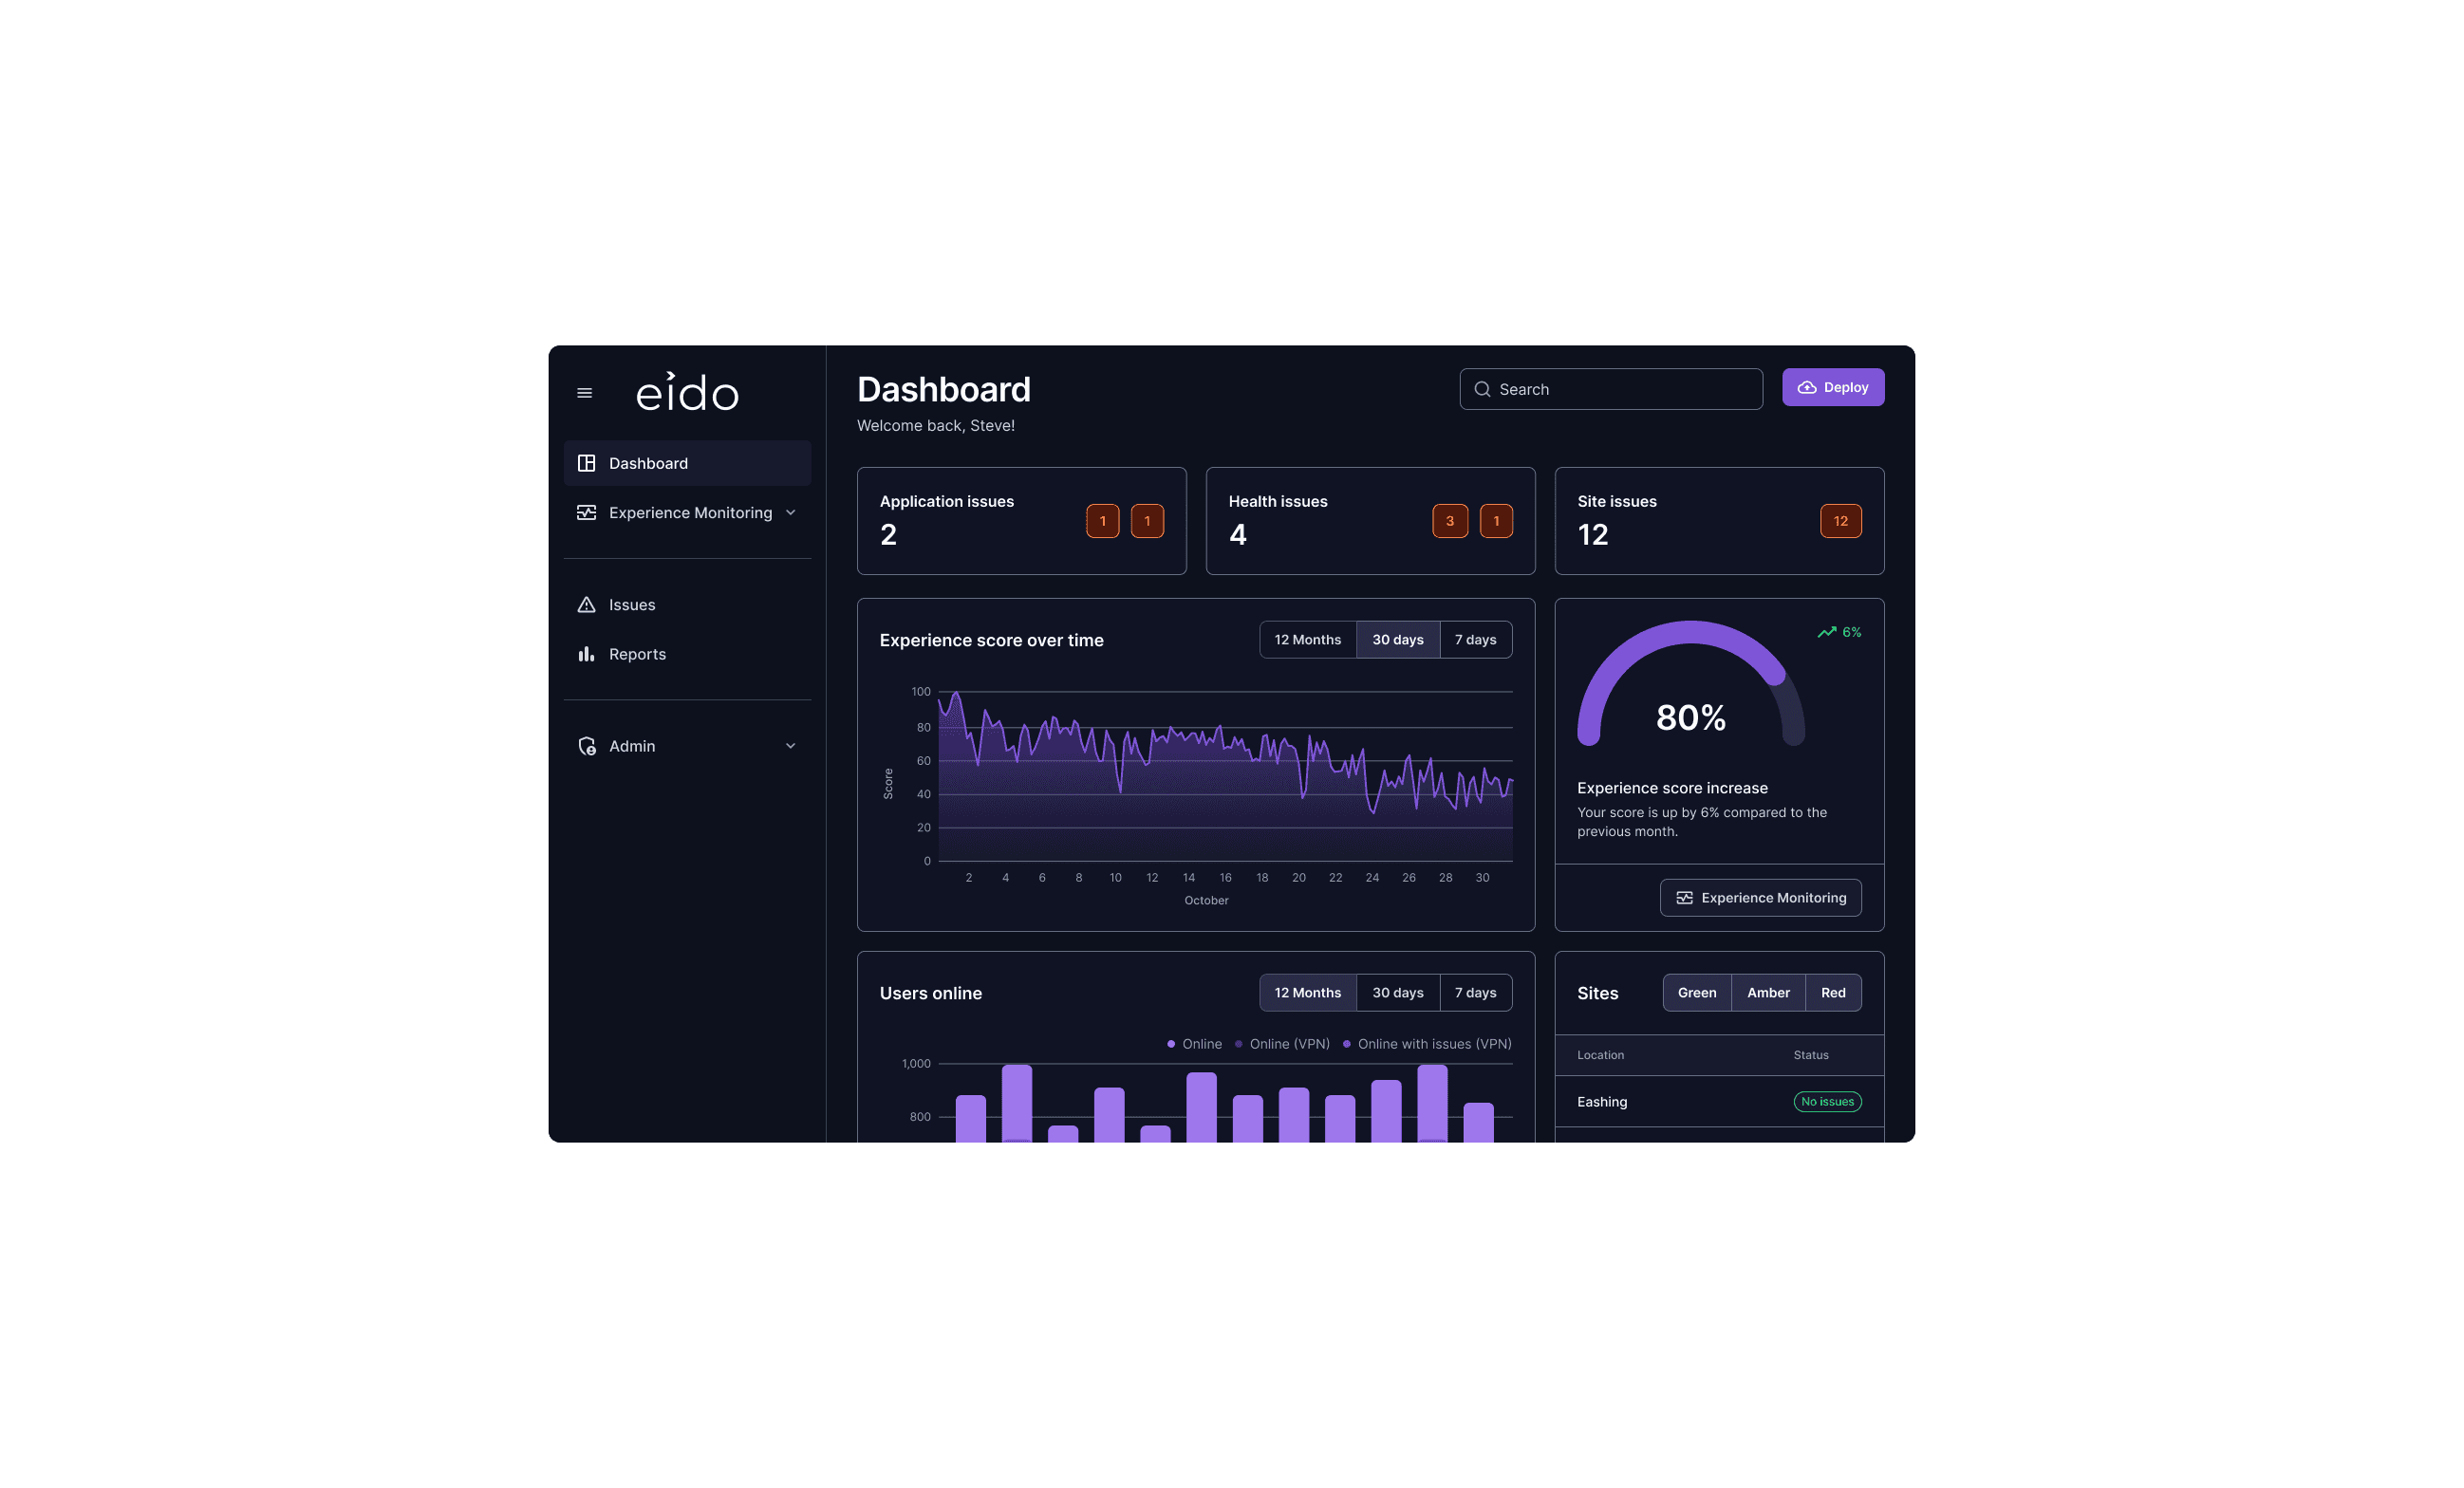
Eido dashboard overview — issue count cards, an experience score chart with 80% gauge, users online bars and a sites status table

From Dashboard to Detail

Working on Eido's interface was an interesting challenge in making complex IT management feel accessible. The platform uses a dashboard-to-detail approach: surface-level views give IT teams the high-level health of their environment at a glance, then allow them to drill down into progressively more granular data when something needs attention.

Eido navigation sidebar with the Experience Monitoring section expanded to show Devices, Sites, Applications, VPN and Bandwidth Monitoring
Close-up of Eido's experience score chart, plotting a purple score line across a month
Eido component sheet — button CTAs in status colours, checkbox states, issue-status pills, input fields and slider variants

Building a Scalable and Cohesive Design System for Enterprise IT Management

To maintain consistency across Eido's expanding feature set, a comprehensive style guide and component library was developed that could scale with the platform's complexity. The system prioritised reusable patterns for data-dense interfaces, including status indicator colours that worked across compliance, policy, and device health contexts, and alert components with clear visual hierarchy for different severity levels.

  • Eido dashboard overview — issue count cards, experience score chart and gauge, users online bars and a sites status table
  • Eido navigation sidebar with the Experience Monitoring section expanded to show Devices, Sites, Applications, VPN and Bandwidth Monitoring
  • Eido users online chart — stacked purple bars comparing online, VPN and issue-affected users by month
  • Close-up of Eido's experience score chart, plotting a purple score line across a month
  • Eido dashboard cards showing a site issues count, an 80% experience score gauge and a sites table with per-location issue status pills
  • Eido dashboard overview — issue count cards, experience score chart and gauge, users online bars and a sites status table
  • Eido navigation sidebar with the Experience Monitoring section expanded to show Devices, Sites, Applications, VPN and Bandwidth Monitoring
  • Eido users online chart — stacked purple bars comparing online, VPN and issue-affected users by month
  • Close-up of Eido's experience score chart, plotting a purple score line across a month
  • Eido dashboard cards showing a site issues count, an 80% experience score gauge and a sites table with per-location issue status pills
  • Eido dashboard overview — issue count cards, experience score chart and gauge, users online bars and a sites status table
  • Eido navigation sidebar with the Experience Monitoring section expanded to show Devices, Sites, Applications, VPN and Bandwidth Monitoring
  • Eido users online chart — stacked purple bars comparing online, VPN and issue-affected users by month
  • Close-up of Eido's experience score chart, plotting a purple score line across a month
  • Eido dashboard cards showing a site issues count, an 80% experience score gauge and a sites table with per-location issue status pills

Steve Hobbs ©

Steve Hobbs ©

Steve Hobbs ©